MTR (My Traceroute) is a network diagnostic tool that combines the functionality of the traceroute and ping programs in a single network diagnostic tool. This guide will walk you through how to use MTR to provide a traceroute.
Step 1: Install MTR
MTR may not be installed on your system by default. Here's how to install it:
On Ubuntu/Debian:
Open a terminal and type:
sudo apt-get install mtrOn CentOS/RHEL:
Open a terminal and type:
sudo yum install mtrOn macOS:
If you have Homebrew installed, open a terminal and type:
brew install mtrTo install MTR on Windows:
- Download the latest version of WinMTR
- You will have a .zip file containing two folders: WinMTR-32 and WinMTR-64
- Each folder contains two files: WinMTR.exe and README.txt
- Extract the WinMTR.exe that corresponds to your platform (32 or 64 bit) and run the file.
To run WinMTR on Windows:
- Start WinMTR.
- Write the name or IP of the host (e.g. webgee.com or your website domain)
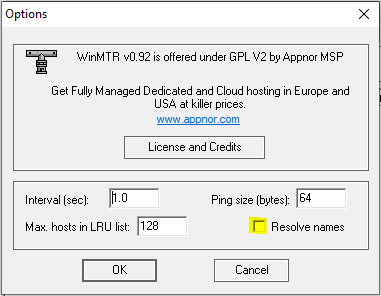
- Press the Options button to configure ping size, maximum hops, ping interval and untick Resolve names (the defaults are OK).
- Push the Start button and wait.
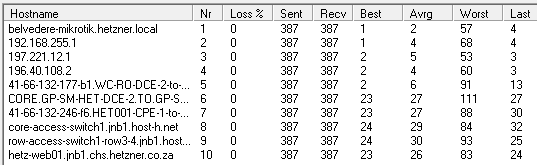
- Copy or export the results in text or HTML format. The results should look similar to this:
- Click on Clear History in the drop-down menu to remove the hosts you have previously traced.
To run WinMTR from Windows command:
- Copy the WinMTR.exe file in Windows/System32 so that it’s accessible via the command line – cmd.
- Run winmtr -help to see the options available.
- Run winmtr hostname (e.g. Xneelo.co.za).
Step 2: Run MTR
To run MTR, open a terminal and type:
mtr <hostname or IP address>Replace <hostname or IP address> with the hostname or IP address you want to trace.
For example, if you wanted to trace the route to google.com, you would type:
mtr google.comStep 3: Interpret the Results
MTR will start running and display a live updated report. Each line of the report represents a hop in the route. Here's what the columns mean:
- Host: The hostname and IP address of each hop.
- Loss%: The percentage of packet loss at each hop.
- Snt: The total number of packets sent to each hop.
- Last/Avg/Best/Wrst/StDev: These columns show various timing statistics for the packets sent to each hop.
Step 4: Provide the Traceroute
You'll need to stop MTR and copy the results to provide the traceroute. Press Ctrl+C to stop MTR. Then, select the text in the terminal and copy it. You can then paste this text into an email, a support ticket, or any other form of communication.
Remember, MTR provides a live, ongoing traceroute, so the longer you leave it running, the more accurate the results will be. It's recommended to let MTR run for a few minutes before stopping it and copying the results.